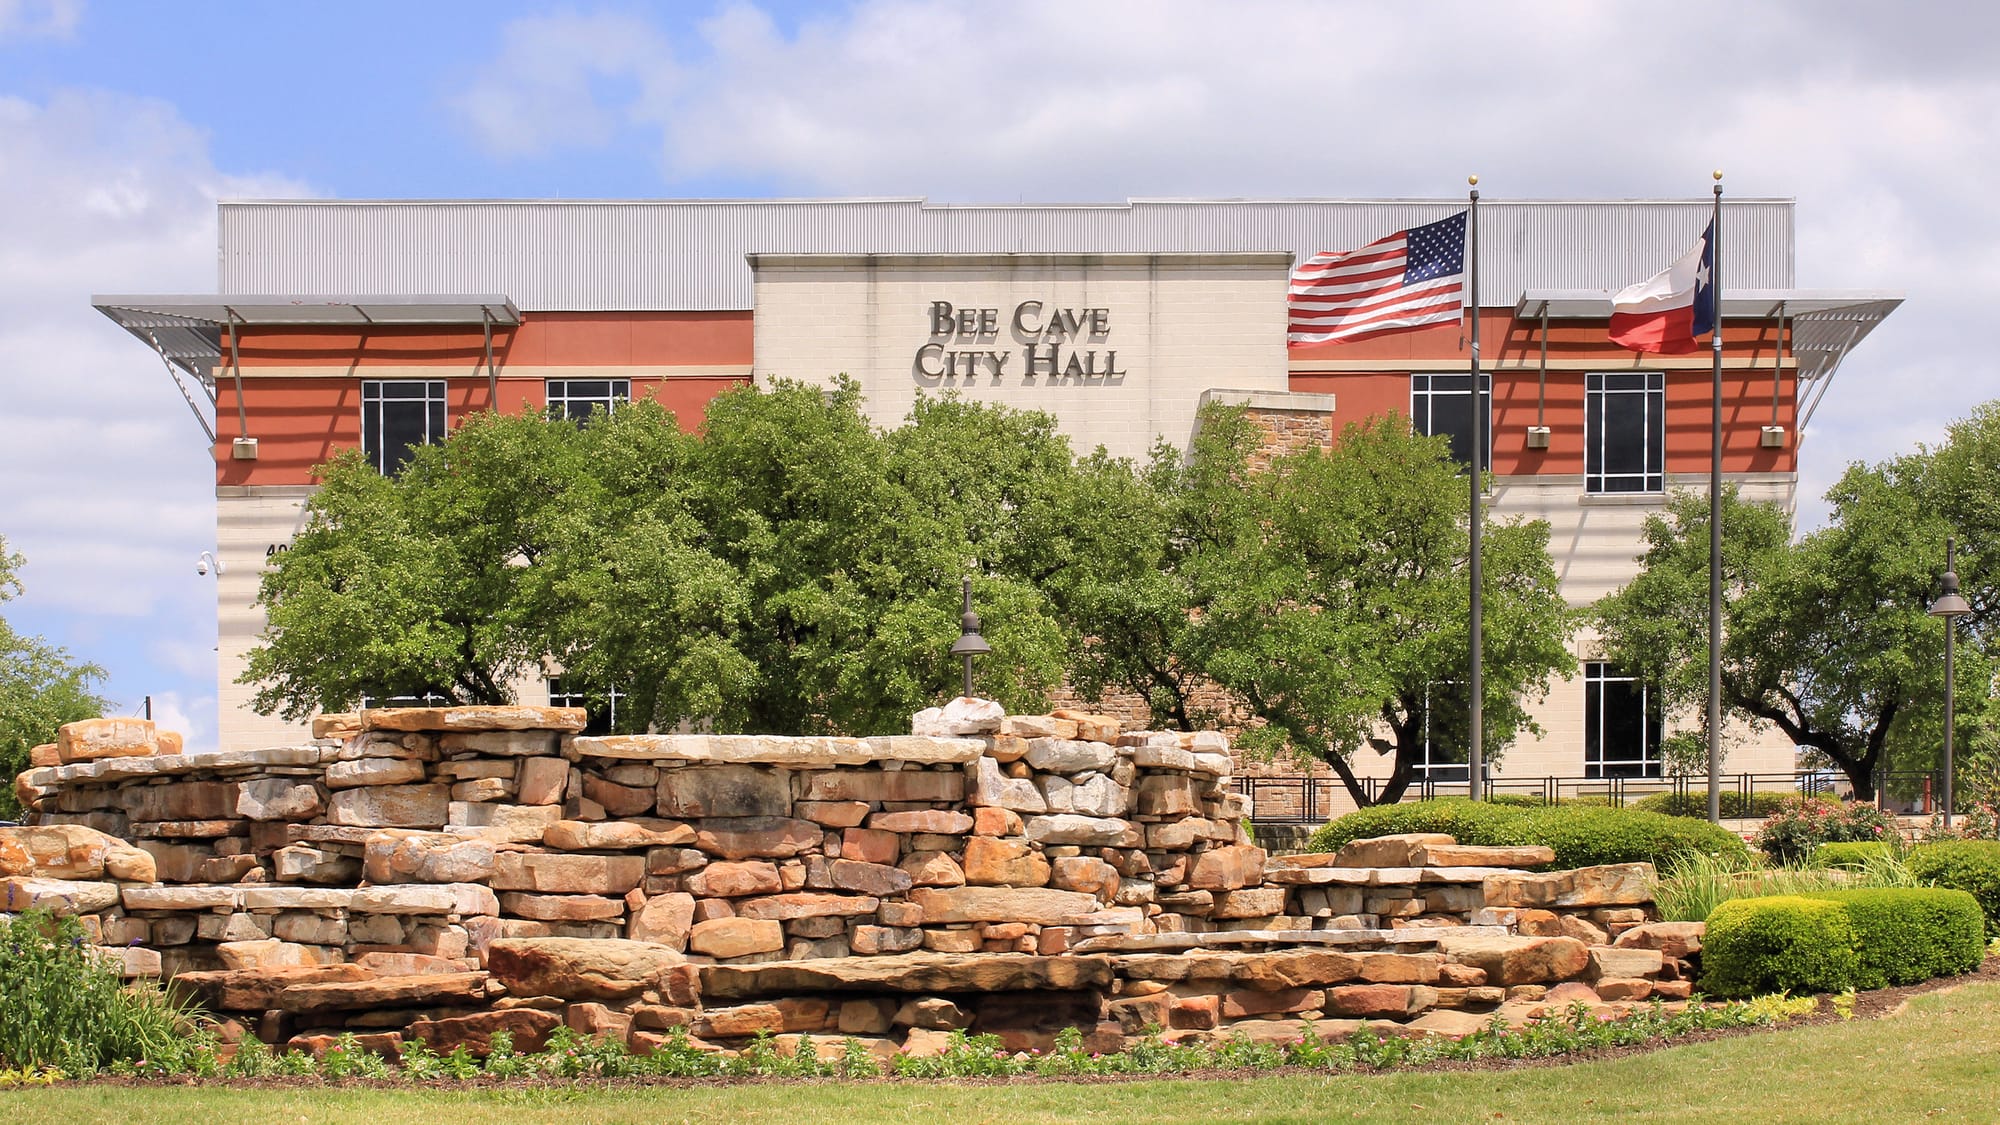


Montgomery County closed home sales for July 2026: 136 closings at a $622,000 median, compared with July 2025, plus the $750K+ and luxury markets and a city-by-city breakdown.
Here is how July 2026 closed for residential sales in Montgomery County, from sales recorded in HAR.com (Houston Association of REALTORS®), set against July 2025. Figures are totals and medians for the area. Texas is a non-disclosure state, so we never publish what an individual home sold for. They cover the cities in our Montgomery County report (The Woodlands), not every sale in the county.
July at a glance
136 homes closed in Montgomery County in July 2026, up 14.3% from 119 in July 2025. The median sale price was $622,000 against $675,000 a year earlier (down 7.9%). Per square foot, the median was $234, down 4.1% from $244. The median home that closed had been on the market 12 days, compared with 11 days in July 2025.
| July 2026 | July 2025 | Change | |
|---|---|---|---|
| Closed sales | 136 | 119 | up 14.3% |
| Median sale price | $622,000 | $675,000 | down 7.9% |
| Median price per sq ft | $234 | $244 | down 4.1% |
| Median days on market | 12 | 11 | longer by 9.1% |
$750,000 and up
52 homes at $750,000 or more closed in July 2026, against 51 in July 2025, at a median of $1.1 million. That was 38% of all closings in the county that month. Of those, 16 closed at $1.5 million or more (13 a year earlier).
The last three months
| Month | Closed | Year before | Median sale | Year before |
|---|---|---|---|---|
| May 2026 | 138 | 152 | $745,000 | $658,000 |
| June 2026 | 131 | 143 | $675,000 | $699,000 |
| July 2026 | 136 | 119 | $622,000 | $675,000 |
Across those three months, 405 homes closed, down 2.2% from the same three months a year earlier.
City by city
| City | Closed | Year before | Median sale | Median days on market |
|---|---|---|---|---|
| The Woodlands | 136 | 119 | $622,000 | 12 |
A dash means fewer than 5 homes closed, too few to report a median without pointing to one home’s price.
The latest numbers
This report covers July 2026. For where Montgomery County stands now, see the current Montgomery County market report, updated weekly with charts and month-by-month comparisons, or sign up to get it monthly. Thinking about buying or selling? Search homes for sale or talk with the team.
Based on closed residential sales recorded in HAR.com (Houston Association of REALTORS®) for July 2026 and July 2025. Medians and totals only; sale-price figures require at least 5 closed sales. Deemed reliable but not guaranteed.
- HAR.com (Houston Association of REALTORS®) residential sales data, HAR.com (Houston Association of REALTORS®), 2026-10-05