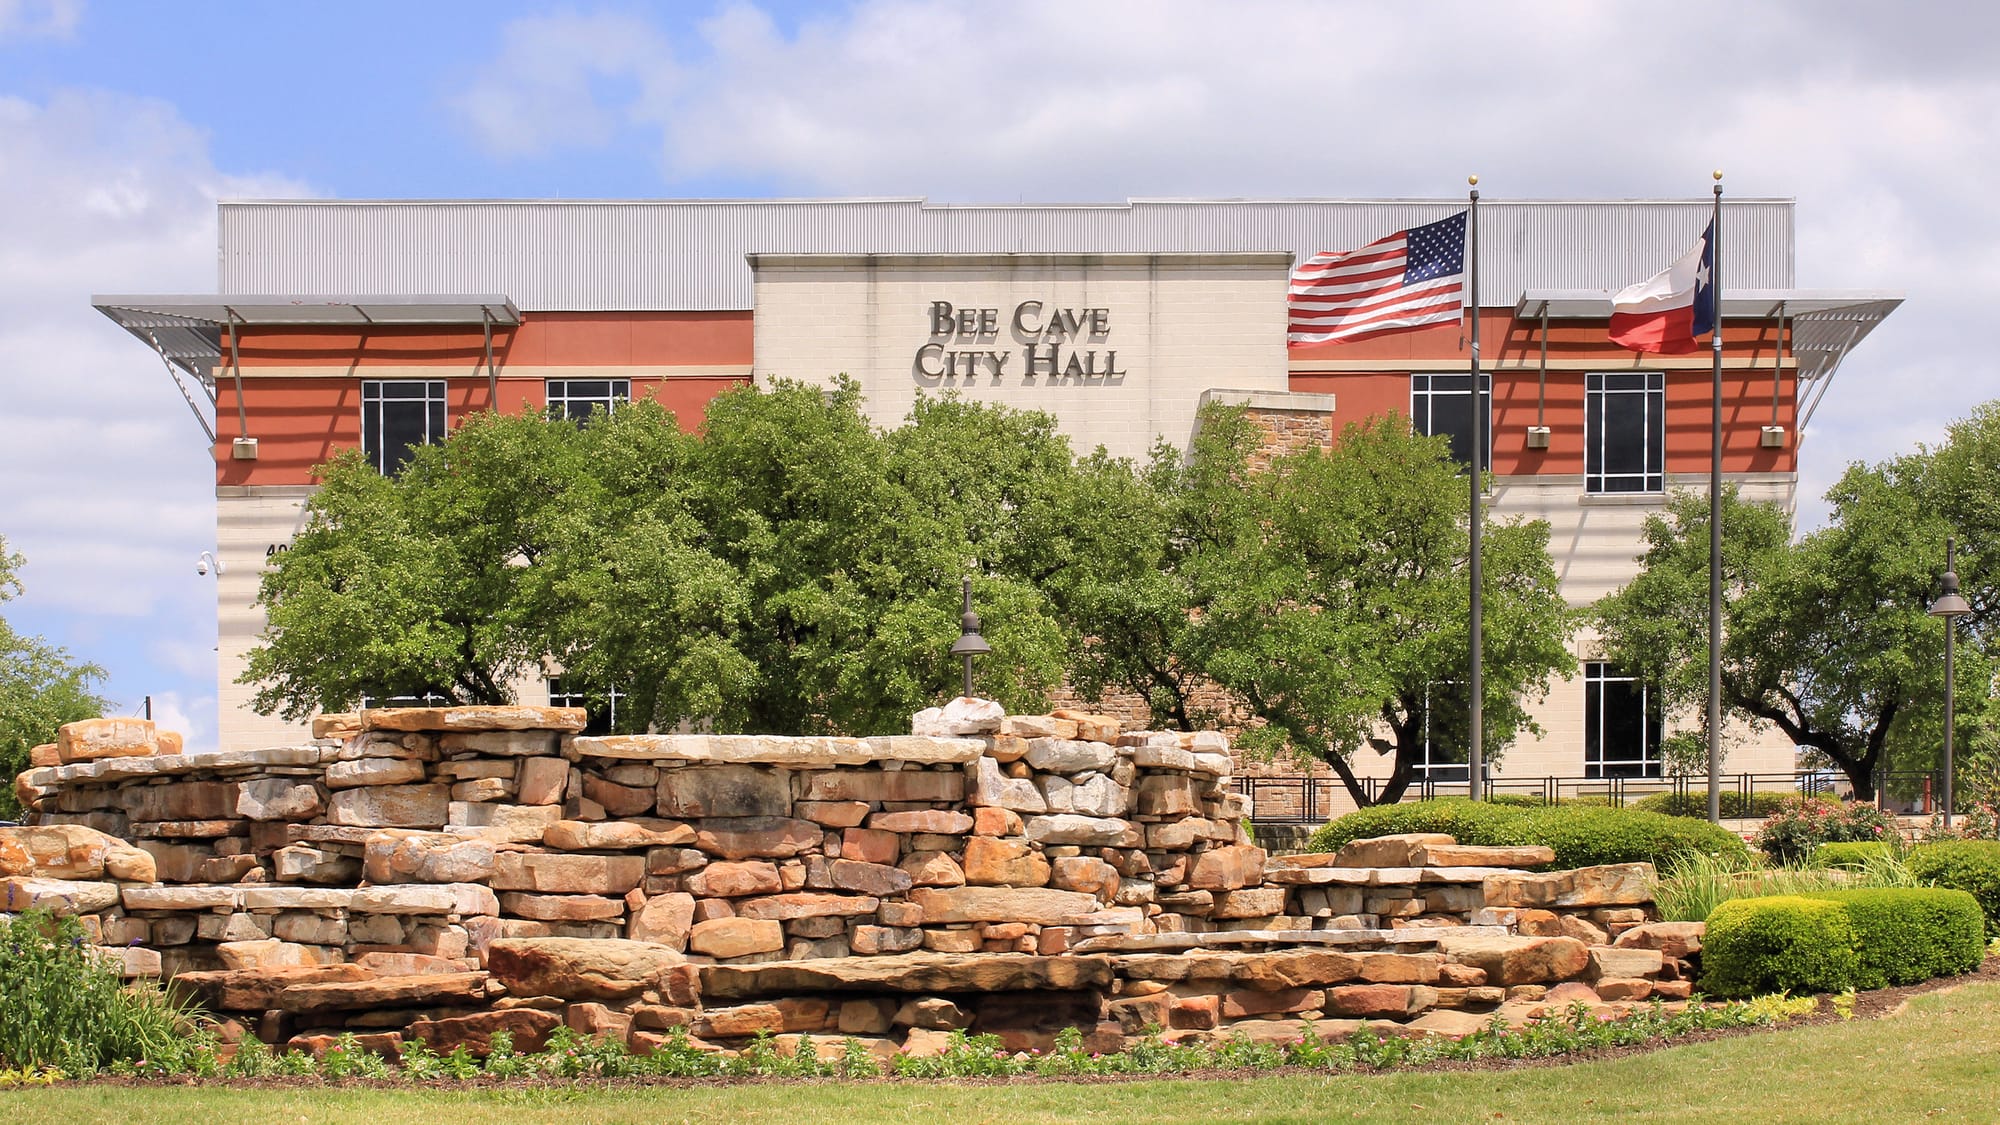


Travis County home sales, October 2026: $890,000 median sale price over the last 12 months, down 1% from the year before, 4,138 closed sales and 1,600 homes for sale. Charts and month-by-month compar
Here is where the Travis County housing market stands this month, from residential sales recorded in Unlock MLS. Every figure is a median or a total for the area; Texas is a non-disclosure state, so we never publish what an individual home sold for. These figures cover the cities in our Travis County report (Austin, West Lake Hills, Bee Cave, Lakeway, The Hills), not every sale in the county.
Over the last 12 months, 4,138 homes closed in Travis County, up 7.6% from the 12 months before. The median sale price was $890,000 (down 1% year over year), and the median home sold in 35 days (faster by 22.2% than a year earlier). There are 1,600 homes for sale right now, about 4.6 months of inventory at the current pace, which by the common rule of thumb is a fairly balanced market.
Changes compare the last 12 months with the 12 months before.
Month by month, against a year ago
In September 2026, 312 homes closed, compared with 335 in September 2025. The median sale price was $900,000, against $850,000 a year earlier. The chart compares each of the last 12 months with the same month the year before.
Odds of selling
Of the homes that either sold or came off the market without selling in the last 12 months, 71% sold. Homes are selling at about 344.8 a month. Pricing, condition and presentation are what move a listing from the right side of this chart to the left.
Homes are selling at 344.8 per month, with 4.6 months of inventory available.
The luxury market ($1.5 million and up)
867 homes priced at $1.5 million or more closed in the last 12 months, at a median of $2.25 million and a median of 39 days on market. 417 are for sale now, about 5.8 months of inventory.
For sale now, by price
City by city
| City | Median sale (12 mo) | Closed (12 mo) | For sale | Days on market |
|---|---|---|---|---|
| Austin | $897,000 | 3709 | 1437 | 35 |
| West Lake Hills | $2.5 million | 42 | 14 | 37 |
| Bee Cave | $847,000 | 30 | 8 | 29 |
| Lakeway | $735,000 | 291 | 125 | 45 |
| The Hills | $963,000 | 64 | 16 | 28 |
Go deeper
See the full Travis County market report, and sign up to get it monthly. Thinking about buying or selling here? Search homes for sale or talk with the team.
Based on information from Unlock MLS, residential sales, data through October 5, 2026. Medians and totals only; sale-price figures require at least 5 closed sales. Deemed reliable but not guaranteed.
Based on information from Unlock MLS (Austin Board of REALTORS®), residential sales, data through October 5, 2026. Figures are medians and totals; individual sale prices are not disclosed, and sale-price figures appear only where there are at least 5 closed sales. Deemed reliable but not guaranteed.
- Unlock MLS residential sales data, Unlock MLS, 2026-10-05